Introduction
If you are a traveler, you should always analyze the accommodation prices.
Being an ambitious Data Science team and somebody, who loves to observe how much details can be scraped from data, we at X-Byte, found a way of combining the two areas, data and traveling into a smaller project.
We have analyzed the prices to rent places at the Airbnb in US’ two cities, Seattle and Boston for answering four fundamental questions:
1: Does any time during the year impact the rent prices? And if yes, then which are the most expensive months for every city?
2: Does the pricing behave in the given manner for both cities?
3: Which city has a higher average price and a more expensive one?
4: Can we utilize the data given to predict places and prices?
The initial step of a project was loading and analyzing the data. Different data that can be used in the project could be available on the Kaggle website, I would leave links about where to get data after completing this blog and a link to complete coding having remarks.
Question 1
For answering the first question, it was required to utilize a calendar dataset. The dataset has a data timeline on prices of various places registered within the Airbnb platform and when they were accessible for rent.

With loaded data, it was required to scrape an average price for every month. It was done by grouping rows by the month as well as calculating the average for every month.
With the Seattle city data, it was likely to get the graph given below:

The graph indicates that for Seattle city, the prices start to increase when summer is coming (in June, July, August), getting maximum values in July.
When the summer gets past, the prices will reduce.
Analyzing Boston city data, we were able to get the given graph:
The graph indicates that for Seattle city, the prices start to increase when summer is coming (in June, July, August), getting maximum values in July.
When the summer gets past, the prices will reduce.
Analyzing Boston city data, we were able to get the given graph:
Question 2
As given in the past analysis, the pricing for every city has its peaks in various seasons. IN Seattle, the fullest (and the most costly) months are summer months, whereas, for Boston, the months are in the fall.
Question 3
As you know the pricing behavior is known right through the year, the question is: which US city is more costly from these two?
One easy way of answering this question is by comparing the graphs made in the past. To do that, we have added one column in every dataset, recognizing the city that belongs to. After that, we concatenated them for creating a sole dataset having average prices every month for these cities.
The results are shown in the graph given below:
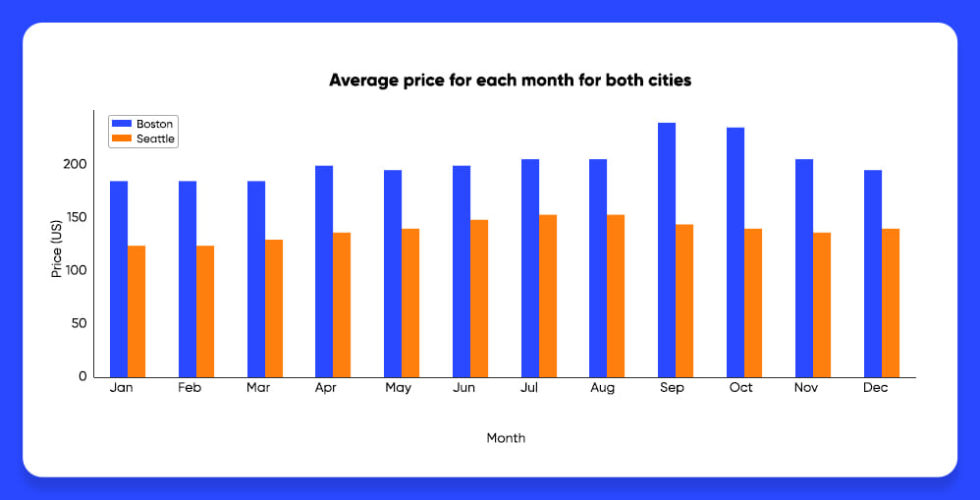
By analyzing this graph, it is evident that in Boston it can be more expensive for renting a place with Airbnb (on average).
Question 4

Cleaning the Data
The initial step required to start the model development after data loading is to clean that.
An initial look at the data display us that:
Some characteristics (like the ID or URL of a review) don’t combine information for predicting a value;
Some data (like square_feet) are having too many null values.
These columns would be rejected and both the datasets would have similar initial columns for analysis.
The following step was dealing with categorical variables. Initially, some columns like description and summary that have many different values, got
replaced with the values 0 or 1 for confirming if a row had the values in the columns.
Then, for the remaining categorical characteristics (excluding amenities), we have made new columns for all possible values in every categorical column. All
these columns were filled using 0 as well as 1 for indicating which possible values these rows have.
The column facilities have data about all the available items in every renting including Wi-Fi, Kitchen, and TV. Therefore, we had taken 10 most general
elements to create 10 newer columns for showing if a row had all the elements available as well as removed the amenity column from this dataset.
The last step of data cleaning was to cope with absent (null) values. We have used two approaches to cope with the problem and the initial one was to remove
the rows from the dataset as well as the second one was replacing the absent values with means of respective columns.
The next step is model development.
phone_pattern = ".?(\d{3}).*(\d{3}).*(\d{4})"
date_pattern = "(\d{2}).(\d{2}).(\d{4})"
name_pattern = "(\w+),\s(Mr|Ms|Mrs|Dr).?\s(\w+)"
url_pattern = "(https?)://(www)?.?(\w+).(\w+)/?(\w+)?"
These analyses were done to answer 4th question:
- Can we forecast the pricing using Seattle data only?
- Can we forecast the pricing using Boston data only?
- Can we forecast the pricing using both cities?
The price predictions are a recession problem: this model would try and calculate the price value using different variables to assist it with the task.
The data was separated into two different sets: one to train the model as well as the other to test it has the proportion of 70% train as well as 30% test. To split data, a function train_test_split of a scikit-learn library was utilized. The pricing column (targeted) was detached from the rest data for every set.
The chosen classifier for the project was Random Forest Regressor and this kind of model utilizes various Decision Trees for determining the outputs rather than using one.
The following step is training the model, through training features as well as training pricing. After this model is accomplished, the testing data is utilized to see how fine this model predicts newer inputs, which were not available during this training stage.
Results
To conclude, to observe how well a classifier has performed, it’s needed to apply a few statistical measures for calculating the performance including R2 Score, Mean Squared Error, and more. For this project, we have used the R2 score to measure performance.
Different results for every analysis are given below:

As given here, the finest result was gained using the Seattle as well as Boston data joined. One possible reason for that might be because the data in the listing dataset is significantly smaller with below 4000 registers for every city as well as with ample variations available (neighborhoods, kinds of accommodations, and more), so additional data may increase the model performance.
Also, thinking about the major difference in training as well as testing results, this model is suffering from overfitting. It means it is learning very well about how to cope with training data however when newer data is given, it fails while trying to forecast the prices.
A way of getting this over-fitting problem is to use cross-validation methods. For the project, we have used a K-Fold method that divides data into testing and training sets K times as well as for every time, this model is tried & tested with different data. The chosen value for K was 5.
The result is attained by taking a mean of 5 results. For every analysis, the results are shown in the figure given below.

Conclusion
Even after using the K-Fold cross-validation technique, this model is still done poorly while dealing with the new data. It could be as the data was inadequate to make a model accomplished of interpreting properly the way data presented in a database.
A possible solution could be to increase the available data in the database, allowing an enormous amount of samples for the model development.
Moreover, different features, which were not examined might prove to be very important variables in the prediction of prices by this model.
Many models are there, which perform reversion. In the project, only a Random Forest Regressor got tested. Might be another model, having similar data, could deliver superior results than the results obtained here.
Still now sure? Contact X-Byte Enterprise Crawling to know more about our Airbnb Data Scraping services or ask for a free quote!
 ✯ Alpesh Khunt ✯