


Divvy bikes supplied open-source information to assess and detect patterns utilizing historical data from the year 2021 (12 months of trip data) to increase yearly subscriptions of existing consumers. The primary goal of the study was to comprehend the situation and devise a strategy for evaluating the data to meet the business objectives. As a result of this study, data insights and visualizations should be generated to complete the conversion.
With almost 2800 bicycles and 300 stations, revolutionize is a fictitious bike-sharing corporation situated in Helsinki. Classic, electric, and docked bikes are the three major types of bikes offered by Revolutionize. According to their prior research, 62 percent of consumers ride for pleasure, 30% travel for work, and 8% utilize an assistive alternative. There are two sorts of riders on Revolutionize: casual riders and yearly members.
Data Source
The Divvy travel data released by Motivate International Inc. provided the datasets for this investigation. The data is provided under the terms of the data license agreement, which offers you a non-exclusive, royalty-free, limited, permanent license to access, reproduce, analyze, duplicate, change, distribute in your product or service, and use the Data for any lawful purpose (“License”).
Location, rider type, date of riding, and type of bike ride were all gathered throughout a 12-months in 2021.
Data Cleaning and Merging
When all of the web scraping datasets were in.CSV format (comma separated values), there was no need to convert the data to another format.
Microsoft Excel is utilized throughout this project to clean the data. Even though there were no serious mistakes in the datasets, data cleaning was required to eliminate blank spaces, arrange the dataset, and make it more user-friendly to use throughout the project.

Because there were 12 datasets, you will consider utilizing Python or Rstudio to combine them into a single data frame using appropriate libraries, however, this procedure failed to owe to many PC hardware limitations and a data frame with 5 million rows and 13 variables. We will use both python and R for merging and cleaning data frames in the past.
Data Processing
Because of the hardware limitations, there are chances of handling the data for each dataset using Microsoft Excel. The data processing step entailed sorting and organizing spreadsheets to fulfill specified requirements to produce the required result.
To obtain the quantifiable metrics, formulas and functions were widely employed, which included identifying the user’s ride length, as well as the bike type favored by both casual riders and yearly members. All of these findings will be presented in a graphical format.
Data Analyzing
Taking the measured information and collecting it into a separate spreadsheet for data visualization and presentation. The findings and a link to the summary spreadsheet are shown below.
Part- 1 Yearly Trend Analysis

From the graph above, it can be seen that both yearly members and casual riders have steadily grown positive trends since February, with the trend peaking in June, July, and August.

Annual members do not use parked bikes, as shown in the bar graph above.

Casual riders utilize more docked bikes than yearly members.
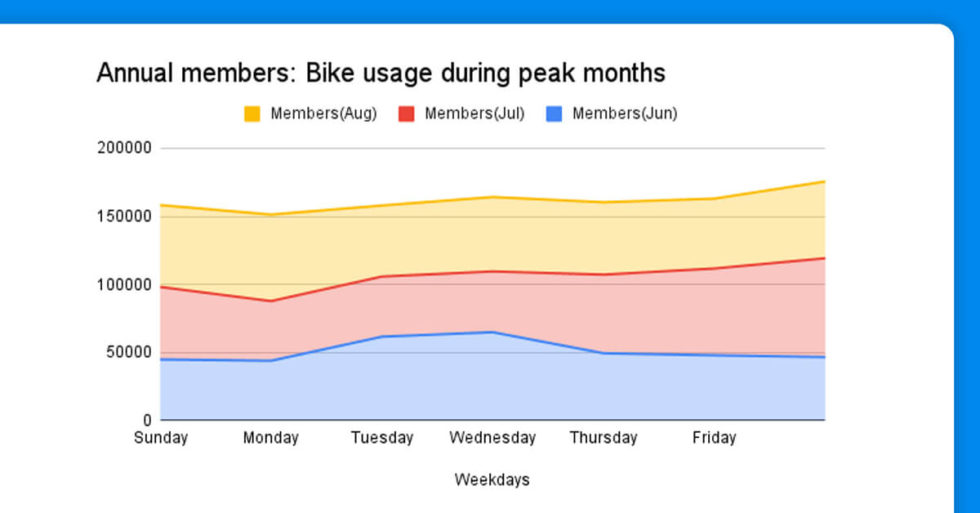
Part 2- Weekend Trend Analysis
def parse_search_page(response):
    """parsed results from TripAdvisor search page"""
    sel = Selector(text=response.text)
    parsed = []
    # we go through each result box and extract id, url and name:
    for result_box in sel.css("div.listing_title>a"):
        parsed.append(
            {
                "id": result_box.xpath("@id").get("").split("_")[-1],
                "url": result_box.xpath("@href").get(""),
                "name": result_box.xpath("text()").get("").split(". ")[-1],
            }
        )
    return parsed


async def scrape_search(query:str, session:httpx.AsyncClient):
    """Scrape all search results of a search query"""
    # scrape first page
    log.info(f"{query}: scraping first search results page")
    hotel_search_url = 'https://www.tripadvisor.com/' + (await search_location(query, session))['HOTELS_URL']
    log.info(f"found hotel search url: {hotel_search_url}")
    first_page = await session.get(hotel_search_url)

    # extract paging meta information from the first page: How many pages there are?
    sel = Selector(text=first_page.text)
    total_results = int(sel.xpath("//div[@data-main-list-match-count]/@data-main-list-match-count").get())
    next_page_url = sel.css('a[data-page-number="2"]::attr(href)').get()
    page_size = int(sel.css('a[data-page-number="2"]::attr(data-offset)').get())
    total_pages = int(math.ceil(total_results / page_size))

    # scrape remaining pages concurrently
    log.info(f"{query}: found total {total_results} results, {page_size} results per page ({total_pages} pages)")
    other_page_urls = [
        # note "oa" stands for "offset anchors"
        urljoin(str(first_page.url), next_page_url.replace(f"oa{page_size}", f"oa{page_size * i}"))
        for i in range(1, total_pages)
    ]
    # we use assert to ensure that we don't accidentally produce duplicates which means something went wrong
    assert len(set(other_page_urls)) == len(other_page_urls)
    other_pages = await asyncio.gather(*[session.get(url) for url in other_page_urls])

    # parse all data and return listing preview results
    results = []
    for response in [first_page, *other_pages]:
        results.extend(parse_search_page(response))
    return results

Annual members’ bike utilization is linear when compared to casual riders’ bike usage trends on weekdays, as shown in the following two bar graphs. Weekends, i.e. Friday, Saturday, and Sunday, are when casual riders utilize their bikes the most.
Suggestions
During the peak bike usage months, from the beginning of June to the end of August, revolutionize could focus more on marketing campaigns and promotional offers on yearly memberships (Casual riders bike usages are higher during these months).


Now that we have our hotel information stored in a Pandas data frame, we can plot the ratings of different hotels against each other to understand better how they differ. It can give us good insight into which hotels are better than others and help us make informed decisions when booking hotels.
Cleaning the Data
Casual riders have the longest average ride length, which can be seen in the riders’ application interface. As a result, even occasional riders may appreciate the value of yearly memberships and the money they can save by doing so.
To boost the conversion rate, revolutionize should spend on marketing and special offers throughout June, July, and August.
Final Words
During the peak months, which are June, July, and August, revolutionize should expect a higher conversion rate. So, by utilizing rider journey data, revolutionize can make better-informed decisions, whether it’s about whether to invest in marketing efforts. Data analytics can answer every query with reliable advice, whether it’s to raise the conversion rate of casual riders to annual members or to boost the conversion rate of casual riders to annual members.
However, to ensure that the offered ideas operate flawlessly, they must be tested internally with all stakeholders and the data-driven decision-making process must be made as painless as possible.
For any web scraping services, contact X-Byte Enterprise Crawling today!
Request for a quote!
 ✯ Alpesh Khunt ✯

Related Blogs

10 Reasons to Choose X-Byte as Your Web Scraping Partner
Scraping Google Maps for USA Restaurant Leads: A Complete Guide for Food Suppliers