In today’s digital era, online shopping if getting tremendous progress. All business persons want to study what their clients say about their products. Different star-ratings and reviews are accessories of products that describes customers’ engagement. The procedure of analyzing customer feelings is known as Sentiment Analysis.
In this blog, we have done Sentiment Analysis on Amazon’s Jewelry Dataset.
The link of Dataset is: https://s3.amazonaws.com/amazon-reviews-pds/tsv/amazon_reviews_us_Jewelry_v1_00.tsv.gz
We need to import the necessary packages:
Introduction
Web scraping is the automated data extraction from websites. There are two types of web scraping: content scraping and structure scraping. Content scraping extracts textual content from a website’s pages, whereas structure scraping involves removing relational data from HTML objects.
A web scraper is an agent that performs web scraping to extract information for further use.
The use of web scrapers can be diverse, such as monitoring online trends or news, updating existing data sets by extracting information from websites and analyzing them further, maintaining sites, detecting broken links, and correcting them.
In addition to being done manually, the software is generally used to automate it. Python is a popular language for web scraping because it has several libraries that make it easy to scrape data from websites.
import pandas as pd
import numpy as np
import nltk
import re
Just read the datasets using pandas
df=pd.read_csv(‘data.tsv’, sep=’\t’, header=0, error_bad_lines=False)
Then preview the datasets
df.head(3)

We need only review_body, star_rating columns that describes star rating and reviews of every review separately.
df=df[[‘review_body’,’star_rating’]]
Then remove missing values, Null, as well as reset an index
df=df.dropna()
df = df.reset_index(drop=True)
df

Tagging Reviews:
As we have got 17, 66,748 reviews, the reviews having star ratings 4,5 are tagged as positive reviews with 1,2 star ratings are tagged as negative reviews. Don’t consider the reviews having star ratings 3 because they are neutral.
df['star_rating']=df['star_rating'].astype(int) #convert the star_rating column to int
df=df[df[‘star_rating’]!=3]
df['label']=np.where(df['star_rating']>=4,1,0) #1-Positve,0-Negative

Total reviews groups by star ratings
df[‘star_rating’].value_counts()
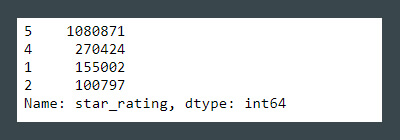
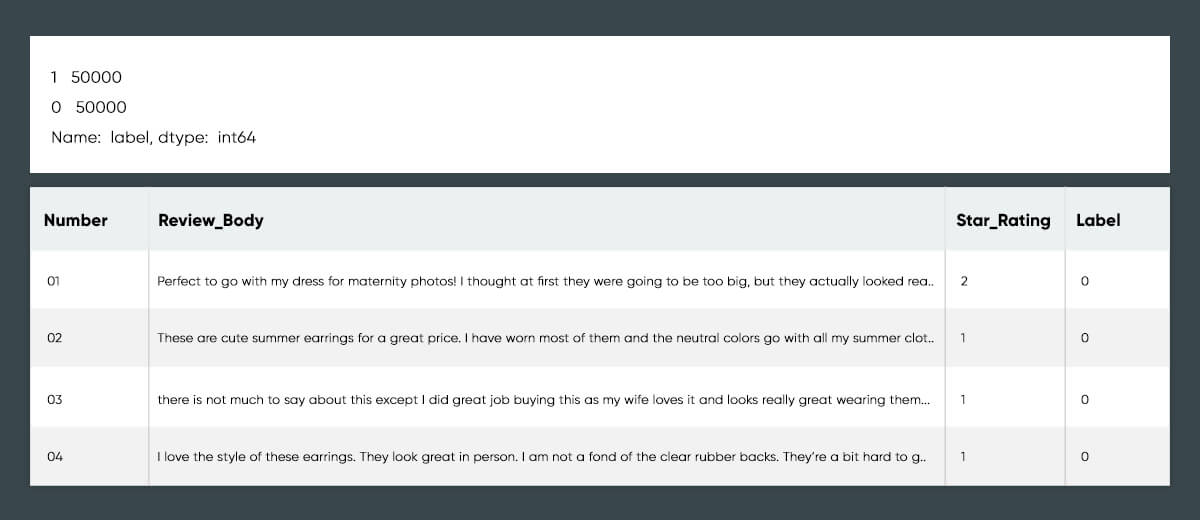
As we are making the model through considering 100000 reviews. From these 1, 00,000 reviews, 50,000 are positive reviews and 50,000 are negative reviews.
We are shuffling these review to get casual 1, 00,000 reviews out of 16,07,094 reviews. You can overlook if you don’t wish to shuffle.
df = df.sample(frac=1).reset_index(drop=True) #shuffle
data=df[df['label']==0][:50000]
data=data.append(df[df['label']==1][:50000])
data = data.reset_index(drop=True)
display(data['label'].value_counts())
data)
Pre-Processing
The initial step is to convert all the reviews into a lower case.
data[‘pre_process’] = data[‘review_body’].apply(lambda x: “ “.join(x.lower() for x in str(x).split()))
Then remove HTML tags as well as URLs from reviews.
from bs4 import BeautifulSoup
data[‘pre_process’]=data[‘pre_process’].apply(lambda x: BeautifulSoup(x).get_text())
import re
data[‘pre_process’]=data[‘pre_process’].apply(lambda x: re.sub(r”http\S+”, “”, x))
Do the Reductions on reviews.
Example: This won’t be changed because this won’t be
def contractions(s):
 s = re.sub(r”won’t”, “will not”,s)
 s = re.sub(r”would’t”, “would not”,s)
 s = re.sub(r”could’t”, “could not”,s)
 s = re.sub(r”\’d”, “ would”,s)
 s = re.sub(r”can\’t”, “can not”,s)
 s = re.sub(r”n\’t”, “ not”, s)
 s= re.sub(r”\’re”, “ are”, s)
 s = re.sub(r”\’s”, “ is”, s)
 s = re.sub(r”\’ll”, “ will”, s)
 s = re.sub(r”\’t”, “ not”, s)
 s = re.sub(r”\’ve”, “ have”, s)
 s = re.sub(r”\’m”, “ am”, s)
 return s
data[‘pre_process’]=data[‘pre_process’].apply(lambda x:contractions(x))
After that, remove the non-alpha characters
data[‘pre_process’]=data[‘pre_process’].apply(lambda x: re.sub(‘ +’, ‘ ‘, x))
Reading the data into a data frame using Pandas
data[‘pre_process’]=data[‘pre_process’].apply(lambda x: “ “.join([re.sub(‘[^A-Za-z]+’,’’, x) for x in nltk.word_tokenize(x)]))
Then remove stop words through using a NLTK package
from nltk.corpus import stopwords
stop = stopwords.words(‘english’)
data[‘pre_process’]=data[‘pre_process’].apply(lambda x: “ “.join([x for x in x.split() if x not in stop]))
Do lemmatization with a wordnet lemmatizer
from nltk.stem import WordNetLemmatizer
lemmatizer = WordNetLemmatizer()
data[‘pre_process’]=data[‘pre_process’].apply(lambda x: “ “.join([lemmatizer.lemmatize(w) for w in nltk.word_tokenize(x)]))
The last Pre-processed reviews will look like:
Original: This looks much better. In fact, printing quality is not very good, and we don’t feel some coating.
Preprocessed: It looks better with picture reality quality with better feel coating.
data

Feature Scraping
TF-IDF: This is the method of scraping features from text data. TF means Term Frequency as well as IDF means Inverse Document Frequency in TF-IDF.
Term Frequency: Total times word comes in the review. For instance, think about 2 reviews in which w1 and w2 represents words with both reviews as well as table defines frequency of the words in any particular review.

The IDF is calculated as
idf(t) = log [ n / df(t) ] + 1
	 = log[ number of documents / number of documents containing the term]+1
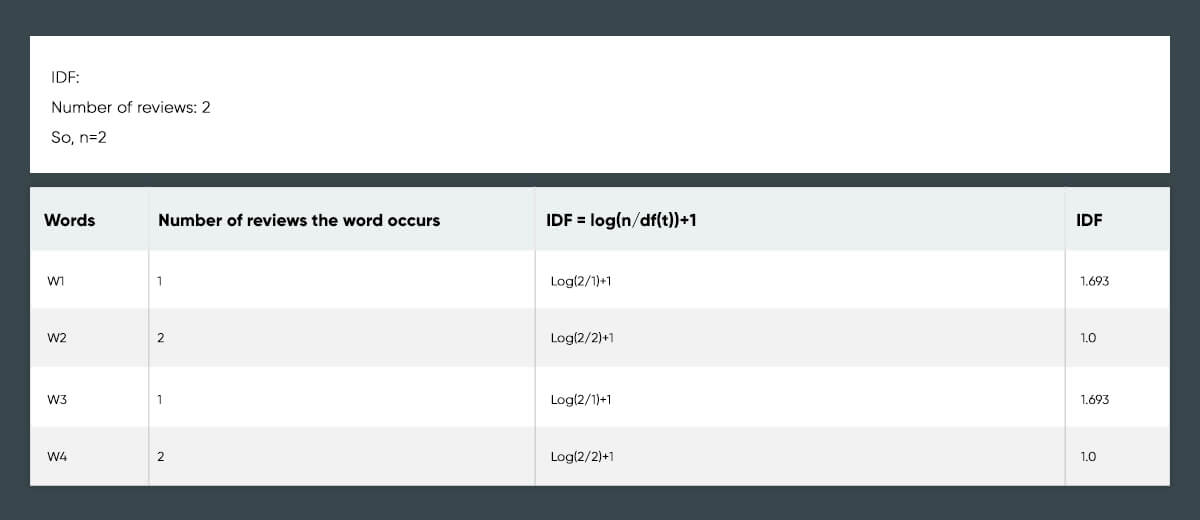
In case, smooth_idf=True.
Then Smooth-IDF = log [ n / df(t) +1 ] + 1
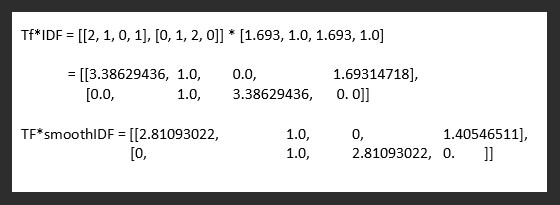
TF-IDF is applied using sklearn at
https://scikit-learn.org/stable/modules/generated/sklearn.feature_extraction.text.TfidfVectorizer.html
Divide data to Training as well as Testing sets
from sklearn.model_selection import train_test_split
	X_train,X_test,Y_train, Y_test = train_test_split(data[‘pre_process’], data[‘label’], test_size=0.25, random_state=30)
	print(“Train: “,X_train.shape,Y_train.shape,”Test: “,(X_test.shape,Y_test.shape))
Use TF*IDF Vectorizer
print(“TFIDF Vectorizer……”)
	from sklearn.feature_extraction.text import TfidfVectorizer
	vectorizer= TfidfVectorizer()
	tf_x_train = vectorizer.fit_transform(X_train)
	tf_x_test = vectorizer.transform(X_test)
SVM
You can implement SVM using sklearn to do classification
from sklearn.svm import LinearSVC
	clf = LinearSVC(random_state=0)
Fitting any Training data to model
clf.fit(tf_x_train,Y_train)
Forecasting the Testing data
y_test_pred=clf.predict(tf_x_test)
Analyzing different results
from sklearn.metrics import classification_report
	report=classification_report(Y_test, y_test_pred,output_dict=True)
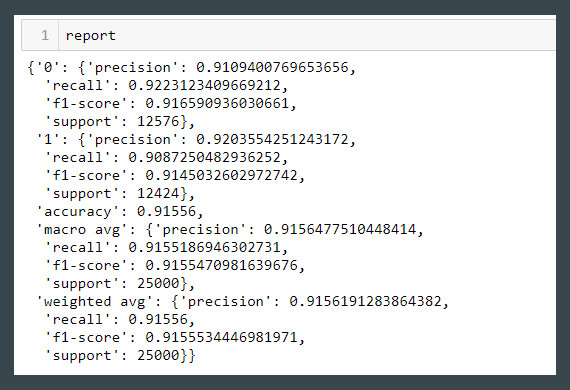
With the Use of SVM Classifier, We Have Got the Precision of 91.55%
Logistic Regression
The logistic regression is applied using sklearn
from sklearn.linear_model import LogisticRegression
	clf = LogisticRegression(max_iter=1000,solver=’saga’)
Fit any Training data into the models
clf.fit(tf_x_train,Y_train)
Forecasting the testing data
y_test_pred=clf.predict(tf_x_test)
Analyze the Reports
from sklearn.metrics import classification_report
	report=classification_report(Y_test, y_test_pred,output_dict=True)
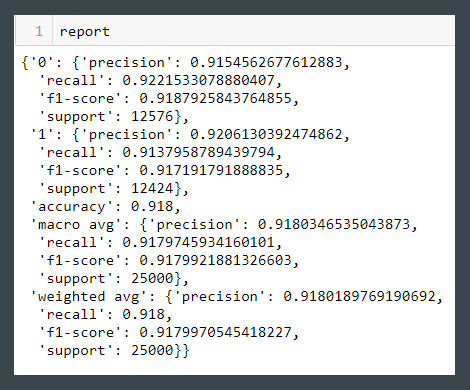
With the Use of LR Classifier, We Have Got the Precision of 91.80%
Therefore, it shows that at X-Byte Enterprise Crawling, we can apply sentiment analysis on almost any data! To know more, contact us!
phone_pattern = ".?(\d{3}).*(\d{3}).*(\d{4})"
date_pattern = "(\d{2}).(\d{2}).(\d{4})"
name_pattern = "(\w+),\s(Mr|Ms|Mrs|Dr).?\s(\w+)"
url_pattern = "(https?)://(www)?.?(\w+).(\w+)/?(\w+)?"
This code will replace all ” #” with spaces and all “&” with & and append the comment before or after.
We can now store this data in a list and display our ranked hotel list to see how they compare.
Once our data is clean, we can analyze it further by plotting a scatter plot of hotel ratings against each other, as shown below.
