

Zillow Home Value, Rent Price, and Housing Units Report 2022


This blog gives a detailed analysis of Zillow Home Value, Rent Price, and Housing Units, and much more.
Key Insights
An increase of 89% in one decade in the San Francisco ZHVI Home Index as the values has reached to $14, 47,463 from $7, 65,910.
67% increase in the San Francisco Zillow Median Rent Price in 7 years from $2,102 to $3,121.
The home values for home owners are extremely high as well as has been increased by 13% since 2016. Although the rents are extremely high, they have dropped by around 2% since 2016.
San Francisco Zillow Median Home Value

| Month & Year | San Francisco ZHVI Home |
|---|---|
| January 2010 | $7, 65,910 |
| February 2010 | $7, 75,025 |
| March 2010 | $7, 74,317 |
| April 2010 | $7, 76,415 |
| May 2010 | $7, 74,632 |
| June 2010 | $7, 75,291 |
| July 2010 | $7, 69,238 |
| August 2010 | $7, 70,334 |
| September 2010 | $7, 70,954 |
| October 2010 | $7, 70,390 |
| November 2010 | $7, 64,627 |
| December 2010 | $7, 53,127 |
| January 2011 | $7, 45,227 |
| February 2011 | $7, 36,279 |
| March 2011 | $7, 33,120 |
| April 2011 | $7, 30,090 |
| May 2011 | $7, 26,106 |
| June 2011 | $7, 18,700 |
| July 2011 | $7, 15,447 |
| August 2011 | $7, 12,129 |
| September 2011 | $7, 11,796 |
| October 2011 | $7, 10,274 |
| November 2011 | $7, 11,012 |
| December 2011 | $7, 12,527 |
| January 2012 | $7, 12,100 |
| February 2012 | $7, 16,923 |
| March 2012 | $7, 22,572 |
| April 2012 | $7, 28,071 |
| May 2012 | $7, 32,695 |
| June 2012 | $7, 40,116 |
| July 2012 | $7, 52,444 |
| August 2012 | $7, 66,203 |
| September 2012 | $7, 80,944 |
| October 2012 | $7, 94,772 |
| November 2012 | $8, 05,608 |
| December 2012 | $8, 16,570 |
| January 2013 | $8, 33,163 |
| February 2013 | $8, 38,944 |
| March 2013 | $8, 46,996 |
| April 2013 | $8, 54,670 |
| May 2013 | $8, 74,504 |
| June 2013 | $8, 95,052 |
| July 2013 | $9, 08,912 |
| August 2013 | $9, 22,568 |
| September 2013 | $9, 29,223 |
| October 2013 | $9, 35,120 |
| November 2013 | $9, 40,186 |
| December 2013 | $9, 51,945 |
| January 2014 | $9, 62,298 |
| February 2014 | $9, 82,210 |
| March 2014 | $9, 97,520 |
| April 2014 | $10, 13,844 |
| May 2014 | $10, 20,845 |
| June 2014 | $10, 22,177 |
| July 2013 | $10, 25,877 |
| August 2014 | $10, 22,948 |
| September 2014 | $10, 25,961 |
| October 2014 | $10, 31,469 |
| November 2014 | $10, 49,923 |
| December 2014 | $10, 59,909 |
| January 2015 | $10, 64,917 |
| February 2015 | $10, 74,153 |
| March 2015 | $10, 89,476 |
| April 2015 | $11, 07,903 |
| May 2015 | $11, 15,503 |
| June 2015 | $11, 31,163 |
| July 2015 | $11, 51,364 |
| August 2015 | $11, 75,125 |
| September 2015 | $11, 95,670 |
| October 2015 | $12, 11,440 |
| November 2015 | $12, 15, 546 |
| December 2015 | $12, 25,508 |
| January 2016 | $12, 41,215 |
| February 2016 | $12, 48,299 |
| March 2016 | $12, 44,998 |
| April 2016 | $12, 30,543 |
| May 2016 | $12, 24,624 |
| June 2016 | $12, 24,426 |
| July 2016 | $12, 14,141 |
| August 2016 | $12, 03,074 |
| September 2016 | $12, 01,927 |
| October 2016 | $12, 08,183 |
| November 2016 | $12, 20,506 |
| December 2016 | $12, 26,691 |
| January 2017 | $12, 28,062 |
| February 2017 | $12, 24,104 |
| March 2017 | $12, 22,882 |
| April 2017 | $12, 31,321 |
| May 2017 | $12, 44,485 |
| June 2017 | $12, 58, 637 |
| July 2017 | $12, 73,268 |
| August 2017 | $12, 89,460 |
| September 2017 | $13, 03,985 |
| October 2017 | $13, 12,302 |
| November 2017 | $13, 20,741 |
| December 2017 | $13, 28,135 |
| January 2018 | $13, 36,787 |
| February 2018 | $13, 48,900 |
| March 2018 | $13, 71,221 |
| April 2018 | $13, 91,886 |
| May 2018 | $14, 02,875 |
| June 2018 | $14, 17,308 |
| July 2018 | $14, 27,002 |
| August 2018 | $14, 38,536 |
| September 2018 | $14, 39,245 |
| October 2018 | $14, 40,113 |
| November 2018 | $14, 34,518 |
| December 2018 | $14, 24,512 |
| January 2019 | $14, 23,346 |
| February 2019 | $14, 21,030 |
| March 2019 | $14, 18,182 |
| April 2019 | $14, 09,879 |
| May 2019 | $14, 14,972 |
| June 2019 | $14, 16,975 |
| July 2019 | $14, 25,101 |
| August 2019 | $14, 23,579 |
| September 2019 | $14, 28,493 |
| October 2019 | $14, 33,884 |
| November 2019 | $14, 41,638 |
| December 2019 | $14, 52,909 |
| January 2020 | $14, 56,481 |
| February 2020 | $14, 59,511 |
| March 2020 | $14, 56,641 |
| April 2020 | $14, 56,032 |
| May 2020 | $14, 47,463 |
San Francisco Zillow Median Rent Price

| Month & Year | Asking Rent |
|---|---|
| January 2014 | $2,102 |
| February 2014 | $2,163 |
| March 2014 | $2,166 |
| April 2014 | $2,182 |
| May 2014 | $2,254 |
| June 2014 | $2,331 |
| July 2014 | $2,368 |
| August 2014 | $2,413 |
| September 2014 | $2,460 |
| October 2014 | $2,475 |
| November 2014 | $2,476 |
| December 2014 | $2,491 |
| January 2015 | $2,522 |
| February 2015 | $2,552 |
| March 2015 | $2,580 |
| April 2015 | $2,604 |
| May 2015 | $2,626 |
| June 2015 | $2,669 |
| July 2015 | $2,716 |
| August 2015 | $2,734 |
| September 2015 | $2,751 |
| October 2015 | $2,758 |
| November 2015 | $2,751 |
| December 2015 | $2,756 |
| January 2016 | $2,762 |
| February 2016 | $2,780 |
| March 2016 | $2,803 |
| April 2016 | $2,830 |
| May 2016 | $2,843 |
| June 2016 | $2,872 |
| July 2016 | $2,836 |
| August 2016 | $2,871 |
| September 2016 | $2,859 |
| October 2016 | $2,842 |
| December 2016 | $2,821 |
| January 2017 | $2,826 |
| February 2017 | $2,835 |
| March 2017 | $2,846 |
| April 2017 | $2,868 |
| May 2017 | $2,887 |
| June 2017 | $2,916 |
| July 2017 | $2,936 |
| August 2017 | $2,951 |
| September 2017 | $2,941 |
| October 2017 | $2,924 |
| November 2017 | $2,920 |
| December 2017 | $2,914 |
| January 2018 | $2,928 |
| February 2018 | $2,927 |
| March 2018 | $2,948 |
| April 2018 | $2,967 |
| May 2018 | $2,993 |
| June 2018 | $3,023 |
| July 2018 | $3,041 |
| August 2018 | $3,051 |
| September 2018 | $3,055 |
| October 2018 | $3,031 |
| November 2018 | $3,015 |
| December 2018 | $3,020 |
| January 2019 | $3,029 |
| February 2019 | $3,052 |
| March 2019 | $3,068 |
| April 2019 | $3,087 |
| May 2019 | $3,102 |
| June 2019 | $3,127 |
| July 2019 | $3,145 |
| August 2019 | $3,151 |
| September 2019 | $3,140 |
| October 2019 | $3,120 |
| November 2019 | $3,105 |
| December 2019 | $3,094 |
| January 2020 | $3,111 |
| February 2020 | $3,128 |
| March 2020 | $3,140 |
| April 2020 | $3,123 |
| May 2020 | $3,121 |
San Francisco Housing Units with New Permits

| Year & Quarter | Building Permits (Total Units) |
|---|---|
| Q1 2009 | 12 |
| Q2 2009 | 38 |
| Q3 2009 | 50 |
| Q4 2009 | 200 |
| Q1 2010 | 29 |
| Q2 2010 | 216 |
| Q3 2010 | 176 |
| Q4 2010 | 358 |
| Q1 2011 | 256 |
| Q2 2011 | 619 |
| Q3 2011 | 630 |
| Q4 2011 | 313 |
| Q1 2012 | 199 |
| Q2 2012 | 694 |
| Q3 2012 | 1982 |
| Q4 2012 | 442 |
| Q1 2013 | 443 |
| Q2 2013 | 1425 |
| Q3 2013 | 1010 |
| Q4 2013 | 1596 |
| Q1 2014 | 728 |
| Q2 2014 | 411 |
| Q3 2014 | 858 |
| Q4 2014 | 714 |
| Q1 2015 | 498 |
| Q2 2015 | 855 |
| Q3 2015 | 1024 |
| Q4 2015 | 1288 |
| Q1 2016 | 817 |
| Q2 2016 | 740 |
| Q3 2016 | 728 |
| Q4 2016 | 1802 |
| Q1 2017 | 548 |
| Q2 2017 | 939 |
| Q3 2017 | 756 |
| Q4 2017 | 2011 |
| Q1 2018 | 411 |
| Q2 2018 | 563 |
| Q3 2018 | 1063 |
| Q4 2018 | 661 |
| Q1 2019 | 989 |
| Q2 2019 | 1005 |
| Q3 2019 | 669 |
Home & Rent Value: Home and Rent Value Indices of Zillow
The Zillow Home Value Index (ZHVI) is an average of actual as well as estimated market value of all the homes inside the marker (the values are valued by Zillow). Also, the Zillow Rent Index (ZRI) is an average monthly rent of all the homes within the market. Both these indices were made in such a way that they remain unchanged by a combination of homes for sale or rent in the city. During 2017, San Francisco had the highest rent as well as home value amongst all peers (with Zillow’s indices, given on the upright axes below. Though, some changes in the values from past year have been dissimilar between renters and home owners. The home values for home owners are extremely high as well as has been increasing (13% increase from 2016). Although the rents are extremely high, they have dropped by around 2% since 2016.
Zillow Home Value Index (ZHVI) and Change in 2017
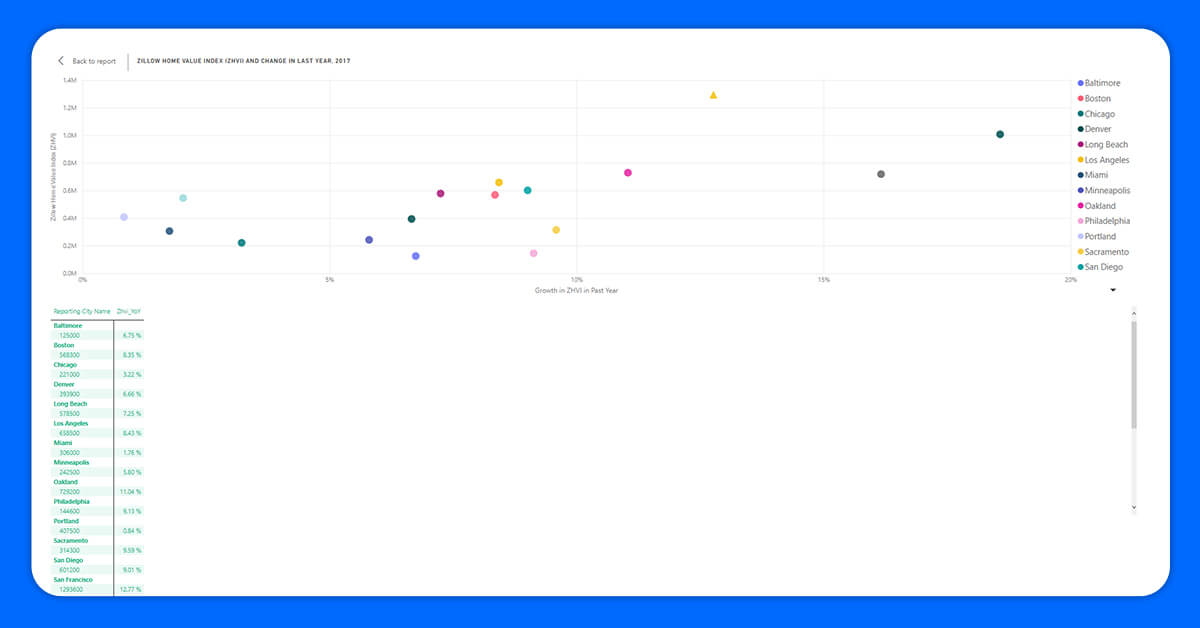
| Reporting City Name | ZHVI (YoY)) |
|---|---|
| Baltimore – 1, 25,000 | 6.75% |
| Boston – 5, 68,300 | 8.35% |
| Chicago – 2, 21,000 | 3.22% |
| Denver – 3, 93,900 | 6.66% |
| Long Beach – 5, 78,500 | 7.25% |
| Los Angeles – 6, 58,500 | 8.43% |
| Miami – 3, 06,000 | 1.76% |
| Minneapolis – 2, 42,500 | 5.80% |
| Oakland – 7, 29,200 | 11.04% |
| Philadelphia – 1, 44,600 | 9.13% |
| Portland – 4, 07,500 | 0.84% |
| Sacramento – 3, 14,300 | 9.59% |
| San Diego – 6, 01,200 | 9.01% |
| San Francisco – 12, 93,600 | 12.77% |
| San Jose – 10, 07,400 | 18.57% |
| Seattle – 7, 18,700 | 16.16% |
| Washington DC – 5, 45,400 | 2.04% |
Zillow Rent Index (ZRI) and Change in 2017

| Reporting City Name | ZRI (YoY) | ZRI |
|---|---|---|
| Baltimore | -0.38% | 1300 |
| Boston | 2.99% | 2584 |
| Chicago | 0.49% | 1652 |
| Denver | 2.78% | 2032 |
| Long Beach | 3.47% | 2448 |
| Los Angeles | 2.95% | 2828 |
| Miami | -3.16% | 2023 |
| Minneapolis | 3.86% | 1613 |
| Oakland | 3.12% | 2972 |
| Philadelphia | 1.24% | 1222 |
| Portland | 2.58% | 1909 |
| Sacramento | 9.75% | 1643 |
| San Diego | 4.58% | 2579 |
| San Francisco | -2.22% | 4311 |
| San Jose | 3.40% | 3403 |
| Seattle | 3.42% | 2570 |
| Washington DC | 1.36% | 2604 |
Fulfill Your Data Requirements
You can prepare yourself through analyzing Zillow data, deriving important insights, as well as building real sales strategies using X-Byte Enterprise Crawling. For personalized data requirements, contact us or ask for a free quote!