
Introduction
In today’s competitive travel industry, making pricing decisions based on outdated or incomplete data can impact both revenue and customer acquisition. Hotel rates, airfare, and car rental prices change constantly due to demand, seasonality, competitor pricing, fuel costs, and regional market conditions. To stay ahead, travel businesses need real-time visibility into these market fluctuations.
Whether you’re an Online Travel Agency (OTA), hotel chain, airline, travel technology company having access to accurate travel pricing data helps you respond faster to market changes, benchmark competitors, optimize pricing strategies, and improve forecasting. Instead of manually monitoring hundreds of travel websites, you can leverage automated travel data intelligence to gain reliable, actionable insights at scale.
In this blog, we’ll explore the latest trends shaping US travel costs and show how real-time travel intelligence can help businesses improve pricing strategies, forecast demand more accurately, and stay ahead in an increasingly competitive travel market.
Why do US Travel Cost Insights Matter Right Now?
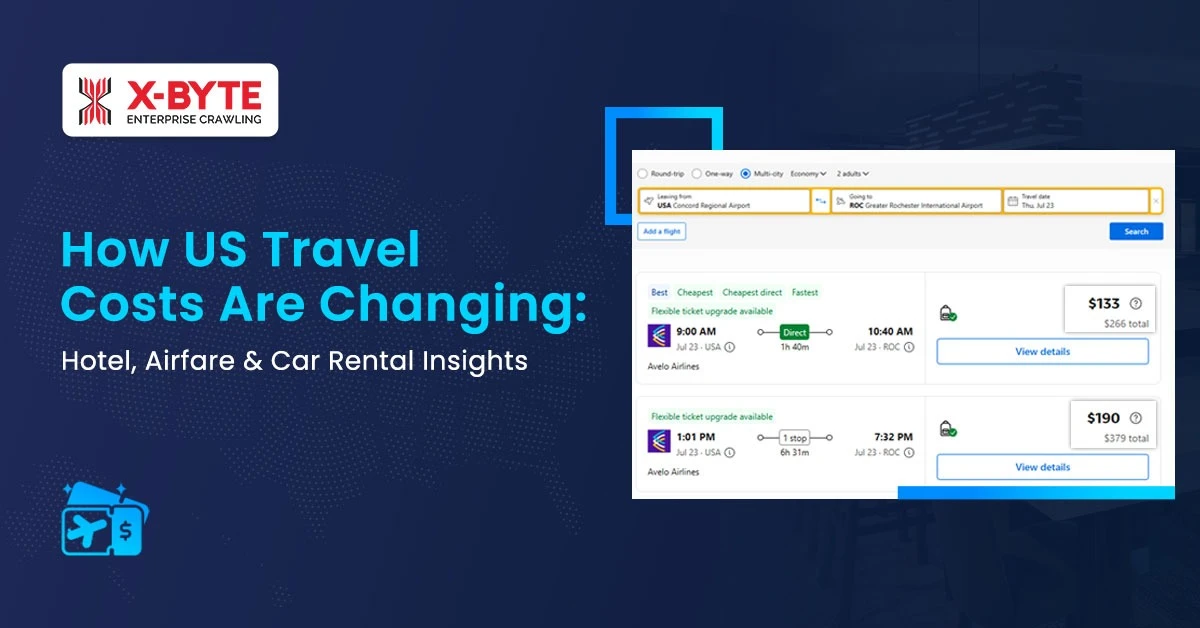
Travel inflation is currently outpacing general inflation in the United States. According to the U.S. Travel Association’s Travel Price Index, airline fares increased 26.7% year over year and 2.7% from April, while hotel prices rose 5.1% year over year, continuing a steady acceleration from 2.1% in March and 4.3% in April. That single data point explains why a trip that felt affordable twelve months ago can feel noticeably heavier on the wallet today.
Several forces are driving this shift at once:
- Jet fuel price swings that ripple directly into airfare.
- Airline capacity cuts on certain domestic routes after carrier exits.
- Steady hotel demand in gateway cities is paired with easing rates elsewhere.
- Car rental fleets that are finally stabilizing after years of pandemic-era volatility.
These US travel cost insights help travelers better time their bookings and help travel businesses, from OTAs to hotel chains, price their offerings with more confidence. This is also where structured travel data scraping becomes valuable, since it lets a business track price movement across thousands of listings instead of guessing from a handful of screenshots. X-Byte’s travel data intelligence services are built for exactly this kind of continuous price tracking.
Average Cost of Hotels in the US
Hotel pricing is the most location-sensitive of the three categories. A downtown room in New York or Miami behaves nothing like a suburban room in a mid-sized city, and the gap has widened further in 2026.
What the Data Shows on Hotel Prices
Recent industry data paint a layered picture rather than a single flat number. Luxury and upper-upscale hotels have been enjoying higher room rates, at 2.4% and 0.4%, respectively, while lower-tier properties have moved in the opposite direction, with economy down 3.2%, mid-scale down 1.2%, and upper mid-scale down 0.6%. Meanwhile, broader travel-price tracking shows that gateway and event-driven US markets such as New York and Miami are holding firm on hotel pricing, even as broader national averages have begun to ease.
Here is what this means in practical terms:
1. Luxury and upper-upscale hotels are gaining pricing power because demand from higher-income travelers has stayed resilient.
2. Economy and mid-scale hotels are actually softening in price, which is good news for budget-conscious travelers.
3. Event-driven cities (major conferences, sports events, festivals) keep short-term rate spikes alive regardless of the national trend.
4. Hotel segments are less pressured as group and business travel demand has yet to return to pre-pandemic levels.
Average hotel rates in America are a moving target for businesses that change weekly by market and property tier. That’s why hospitality teams are increasingly turning to automated hotel data scraping services to track competitor rates in near real time, not quarterly reports.
US Rental Car Price Trends
Rental car costs went through a wild multi-year swing after the pandemic, but the market has since found a steadier rhythm. That said, “steady” does not mean identical everywhere.
Rental Car Cost Analysis by Location and Timing
The single biggest cost driver in car rentals remains the pickup location. In a large pricing study covering 480+ quotes across 15 major U.S. airport markets, downtown and off-airport locations were about $86 cheaper than airport pickup on a 7-night rental, meaning renters paid roughly 18.3% more at airports on average. Booking timing matters too. The same study found that booking 7 days out averaged about 13% cheaper than booking 91 days out, though early bookers risk limited inventory.
Broader inflation data support the idea that rental car pricing has cooled rather than spiked. Baseline projections suggest average daily rental rates worldwide will be about $48 in 2026, a modest 2.8% increase from last year and a stark contrast to the big jumps in 2021 and 2022 that renters experienced. On the demand side, car rental pricing overall is somewhat stable, but SUV rentals are seeing above-average increases as demand for larger vehicles remains strong, along with slower fleet renewal.
Ongoing car rental data scraping will be a boon for businesses that deal in fleet management or competitive pricing tracking. Instead of spot checks, these location and timing gaps will be filled in automatically.
Get Travel Pricing Data You Can Act On
Hotel, airfare & car rental insights, delivered continuously.
Average Airfare in the United States
Airfare is where the 2026 travel cost story gets the most dramatic, and it is the category most exposed to sudden shocks, like fuel price spikes or an airline exiting a market entirely.
Airline fares increased 26.7% year over year, though fares remain only 17.3% above May 2019 levels, compared with overall consumer inflation of 30.8% over the same period. Fuel costs are a major factor: jet fuel prices have fallen roughly 35% since peaking near $4.88 per gallon in early April, though they remain well above year-ago levels.
Market structure has shifted too. In May 2026, Spirit Airlines abruptly shut down after rising fuel costs made operations untenable, and whenever a carrier exits a market, competition on those routes drops, giving remaining airlines more pricing power. Domestic fares are up roughly 15% this summer, and international flights are up 12%.
Route competition still matters most, since a route served by three or four carriers behaves very differently from one where a single airline has the market to itself. Earlier bookings generally lock in lower fares, fuel volatility now reaches ticket prices faster, and ancillary fees like checked baggage charges are climbing alongside base fares.
Tracking average airfare in the United States at the route level is essential for competitive pricing. This fare monitoring on a route-by-route basis is made possible by Xbyte’s airline data scraping solutions.
US Travel Cost Overview: Hotel, Car, and Airfare (2026)
| Category | Year-over-Year Change | Key Driver | Traveler Takeaway |
| Hotel Rates | Up 5.1% overall | Strong demand in gateway cities; group demand still recovering | Luxury holds firm; economy and mid-scale are actually softening |
| Rental Cars | Up roughly 2.8% (2026 baseline forecast) | Fleet stabilization after pandemic-era volatility | Off-airport pickup saves close to 18% versus airport pickup |
| Airfare | Up 26.7% overall | Jet fuel volatility, reduced competition after carrier exits | Book early on multi-carrier routes for the strongest savings |
| Overall Travel Price Index | Up 11% year over year | Combined pressure across airfare, lodging, meals, and rentals | Domestic travel to nearby destinations is trending as a cost-saving choice |
How to Optimize Your US Travel Budget?
Understanding current travel pricing trends and booking strategically can help you reduce expenses and make the most of your US travel budget.
Compare across multiple platforms. Aggregators like Google Flights and Kayak, along with hotel platforms like Booking.com, let you see price spreads before committing.
Choose off-airport car rental pickup. This single decision routinely saves travelers close to 18% on a multi-night rental, based on recent pricing studies.
Book flights on competitive routes early. Routes served by three or more carriers hold prices down; single-carrier routes do not offer the same leverage.
Watch mid-tier and economy hotel segments. These categories are currently softening in price even while luxury properties hold firm, so there is real room to save without sacrificing comfort.
Consider nearby domestic destinations. With international and long-haul airfare rising faster, shorter regional trips are becoming a practical way to control costs this season.
Travel businesses that want to act on these same patterns at scale, rather than checking prices manually, typically turn to automated data pipelines. X-Byte’s travel and hospitality price intelligence service tracks hotel, car rental, and airfare data continuously across major booking platforms, turning raw pricing signals into decisions your revenue team can act on the same day.
Conclusion
US travel cost insights in 2026 tell a layered story rather than a single trend line. Airfare has climbed the fastest, hotel pricing depends heavily on property tier and location, and rental cars have finally settled into a more predictable pattern after years of volatility. None of these three categories move in lockstep, which is exactly why relying on a single average number can be misleading when you are planning a trip or setting prices as a business.
Whether you are a traveler trying to time a booking or a travel business trying to stay competitive, the underlying lesson is the same: current, granular data beats guesswork every time. At X-Byte, we help travel companies, OTAs, and hospitality brands convert hotel, car rental, and airfare pricing data into insights they can act on immediately. If your team needs reliable, real-time travel pricing intelligence, visit www.xbyte.io to see how our data scraping solutions can support smarter travel decisions all year round.
Frequently Asked Questions
 ✯ Alpesh Khunt ✯

Related Blogs
How Web Scraping Is Used to Extract eCommerce Data From eBay
How to Extract UPC & ASIN Data for Better E-commerce Product Insights